U.S. Bancorp
Oct 12, 2026, 2:36 AM PDT
Shortcut
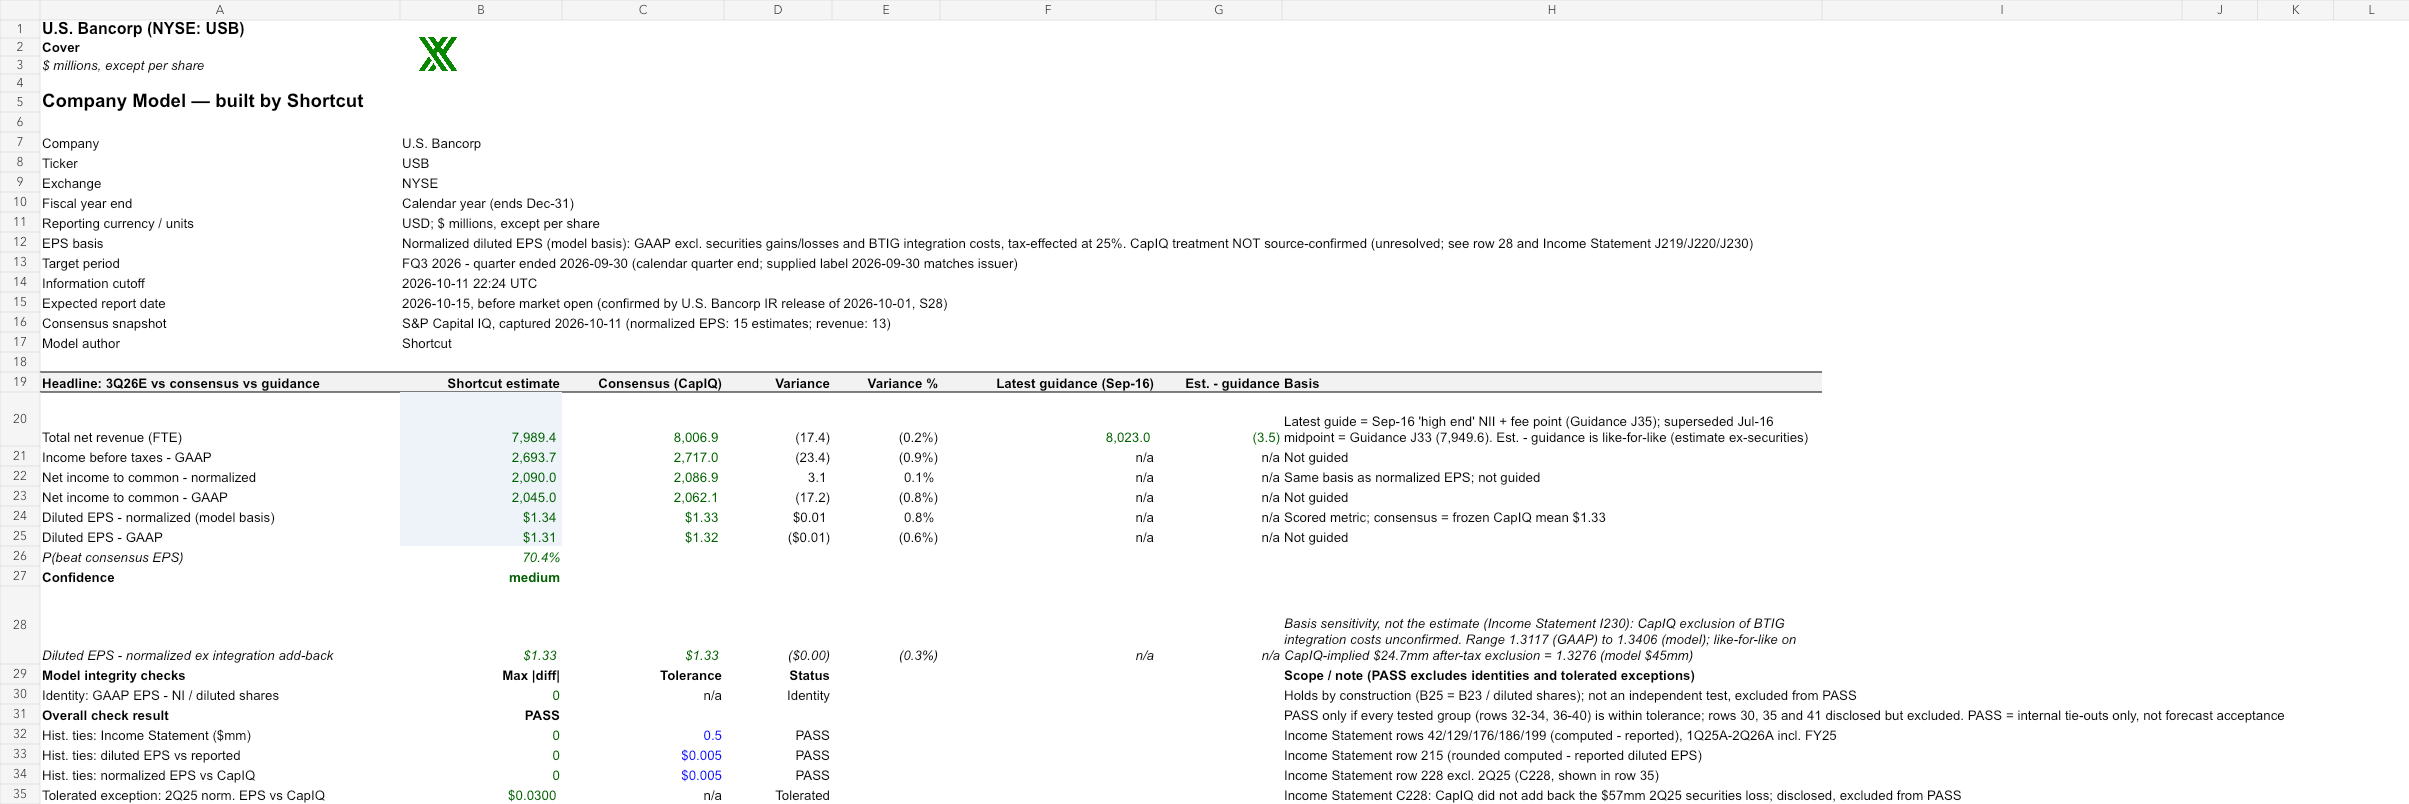
1.34Shortcut normalized EPS
+0.8% vs Street*
Street
1.33Street normalized EPS
Frozen October 11 snapshot
Real
1.34Reported diluted EPS
Shortcut win
Shortcut off by $0.00 · Street off by $0.01.
Uses reported diluted EPS of $1.34. The forecast excludes modeled securities losses and integration costs, so matching normalization adjustments remain unverified. This score compares the unchanged published estimates directly with reported EPS.
Issuer earnings release ↗Explore the model.
Open the assumptions and calculations behind this earnings forecast.
Behind the estimate.
The model forecasts $1.34 per diluted share for the quarter ended September 30, 2026.
Forecast and independent review: Opus 5.5 High in Shortcut.
Model assumptions and review notes
- Modeled normalized EPS; comparability with the frozen Street definition remains unconfirmed. The score compares published values directly.
- F1: exclusion of BTIG integration costs unconfirmed; ex-integration EPS 1.3261 (-0.0144) = in-line at $1.33; CapIQ-implied like-for-like 1.3276. Decides beat vs in-line.
- F1/IS J172: whether the ~$30mm integration cost is embedded in modeled expense I172; if not, normalized EPS overstated by 0.0144.
- F2: add-back of assumed $30mm 3Q26 securities loss (2 of 3 testable quarters support); -0.0144 if not.
- F3: adjustment tax rate 25% vs 20% (+0.0019 at 20%).
- F5: 9M25 CF line holding FX offset unidentified; 3Q25/4Q25 FX rows residual (no EPS effect).
- F6: 3Q26E preferred dividend cash timing (cash only).
- F7: Amazon NII attribution 32 vs build-implied 14.7 in M&A decomposition (no EPS effect).
- Calibration -0.17 judgmental P(beat) adjustment preserved (no EPS effect).
- Retrieval-timing limitation: sources published before the 2026-10-11T22:24:20Z cutoff but retrieved later; documented manifest limitation, not a post-cutoff source.
- Normalized comparator basis (F-01): recognition of the $30mm BTIG integration and $30mm securities-loss add-backs is unconfirmed. Comparable range is $1.3117 to $1.3406; either add-back alone gives $1.3261, below the $1.33 consensus. Sensitivity is -$0.0144 per add-back.
- Tax rate on adjustments (F-02): 25% versus a 20% ETR changes EPS by +$0.0019.
- Amazon $160mm day-1 reserve build stays in normalized EPS. The frozen EBT excl. exceptional is only $6.7mm above GAAP, which is consistent with the pool not excluding it. If excluded it, the comparable would be +160 x 0.75 / 1,559 = +$0.0770.
- Preferred dividends 3Q26E = 104 is a pattern-based assumption. Each $1mm changes EPS by -$0.00064, and 108 (the 3Q25 level) would give $1.3380.
- Cover C22 uses net_income_excl_excep. Whether its basis is to common or to total NI is not stated in the source. It is display-only and does not affect EPS.
- Amazon NII memo attribution (32 vs 14.7) and historical cash-flow FX residuals remain unreconciled, with no EPS effect.
- Market cap is externally sourced (S20, pre-cutoff) because the market_cap_usd_m field is blank. The bucket classification is robust: about 8.9x the $10bn threshold, plus the S&P 500 flag.
On the record.
- Reporting period
- Q3 2026 (quarter ended September 30, 2026), ended 2026-09-30
- Reporting basis
- Normalized diluted EPS per common share, USD = (GAAP NI to common I203 + securities losses I219 + BTIG integration I220 - 25% tax effect I223) / diluted shares I209 (Share Count I31). Model basis; treatment of integration costs and 3Q26 securities losses unconfirmed.
- Published
- Oct 12, 2026, 2:36 AM PDT
- Model / effort
- Opus 5.5 · High effort
Original forecasts, models and publication times remain on the record.
Research sources
- https://s203.q4cdn.com/711684571/files/doc_events/2026/Jul/16/2Q26EarningsSupplement.pdf
- https://www.sec.gov/Archives/edgar/data/36104/000003610426000039/a2q26earningsrelease.htm
- https://s203.q4cdn.com/711684571/files/doc_financials/2026/q1/1Q26EarningsSupplement.pdf
- https://www.sec.gov/Archives/edgar/data/36104/000003610426000021/a1q26earningsrelease.htm
- https://s203.q4cdn.com/711684571/files/doc_financials/2026/q2/USB-2Q26-10-Q.pdf
- https://s203.q4cdn.com/711684571/files/doc_financials/2026/q1/USB-1Q26-10-Q.pdf
- https://www.sec.gov/Archives/edgar/data/36104/000003610425000064/R8.htm
- https://www.sec.gov/Archives/edgar/data/36104/000003610426000011/R8.htm
- https://www.sec.gov/Archives/edgar/data/36104/000003610426000011/usb-20251231.htm
- https://www.fool.com/earnings/call-transcripts/2026/07/23/us-bancorp-usb-q2-2026-earnings-call-transcript/
- https://stockanalysis.com/stocks/usb/transcripts/749859-barclays-24th-annual-global-financial-services-conference/
- https://www.fool.com/earnings/call-transcripts/2026/04/16/us-bancorp-usb-q1-2026-earnings-call-transcript/
- https://www.fool.com/earnings/call-transcripts/2026/01/20/us-bancorp-usb-q4-2025-earnings-call-transcript/
- https://www.sec.gov/Archives/edgar/data/36104/000003610425000060/earningscallpresentation.htm
- https://www.roic.ai/quote/0LHY.L/transcripts/2025-year/2-quarter
- https://beta.earningswhispers.com/article/USB/20339
- https://finance.yahoo.com/markets/stocks/articles/u-bancorp-usb-earnings-expected-130008145.html
- https://stockanalysis.com/stocks/usb/market-cap/
- https://whichindex.com/indexes/sp-500/
- https://www.federalreserve.gov/newsevents/pressreleases/monetary20260916a.htm
- https://trendandticker.com/markets/banks/bank-earnings-preview-q3-2026-jpm-wfc-c-gs-ms-bac-october-13-14
- https://www.americanexpress.com/us/customer-service/faq.amazon-program-update.html
- https://www.sec.gov/Archives/edgar/data/36104/000003610426000005/a4q25earningsrelease.htm
- https://www.sec.gov/Archives/edgar/data/36104/000119312526011142/d37749dex991.htm
- https://www.ad-hoc-news.de/boerse/news/corporate-news/us-bancorp-stock-gained-0-26-percent-on-october-2-as-targets-fell/70233565
- https://ir.usbank.com/news-events/news/news-details/2026/U-S--Bancorp-Announces-Third-Quarter-Earnings-Conference-Call-Details/default.aspx
- https://www.marketbeat.com/instant-alerts/upcoming-us-bancorp-usb-projected-to-announce-earnings-on-thursday-2026-10-08/