BNY Mellon
Oct 12, 2026, 2:36 AM PDT
Shortcut
2.31Shortcut normalized EPS
+2.1% vs Street*
Street
2.26Street normalized EPS
Frozen October 11 snapshot
Real
2.37Issuer adjusted diluted EPS
Shortcut win
Shortcut off by $0.06 · Street off by $0.11.
Uses BNY’s adjusted diluted EPS of $2.37, excluding notable items ($2.34 GAAP diluted EPS). The score compares published values; exact adjustment matching remains unverified.
Issuer earnings release ↗Explore the model.
Open the assumptions and calculations behind this earnings forecast.
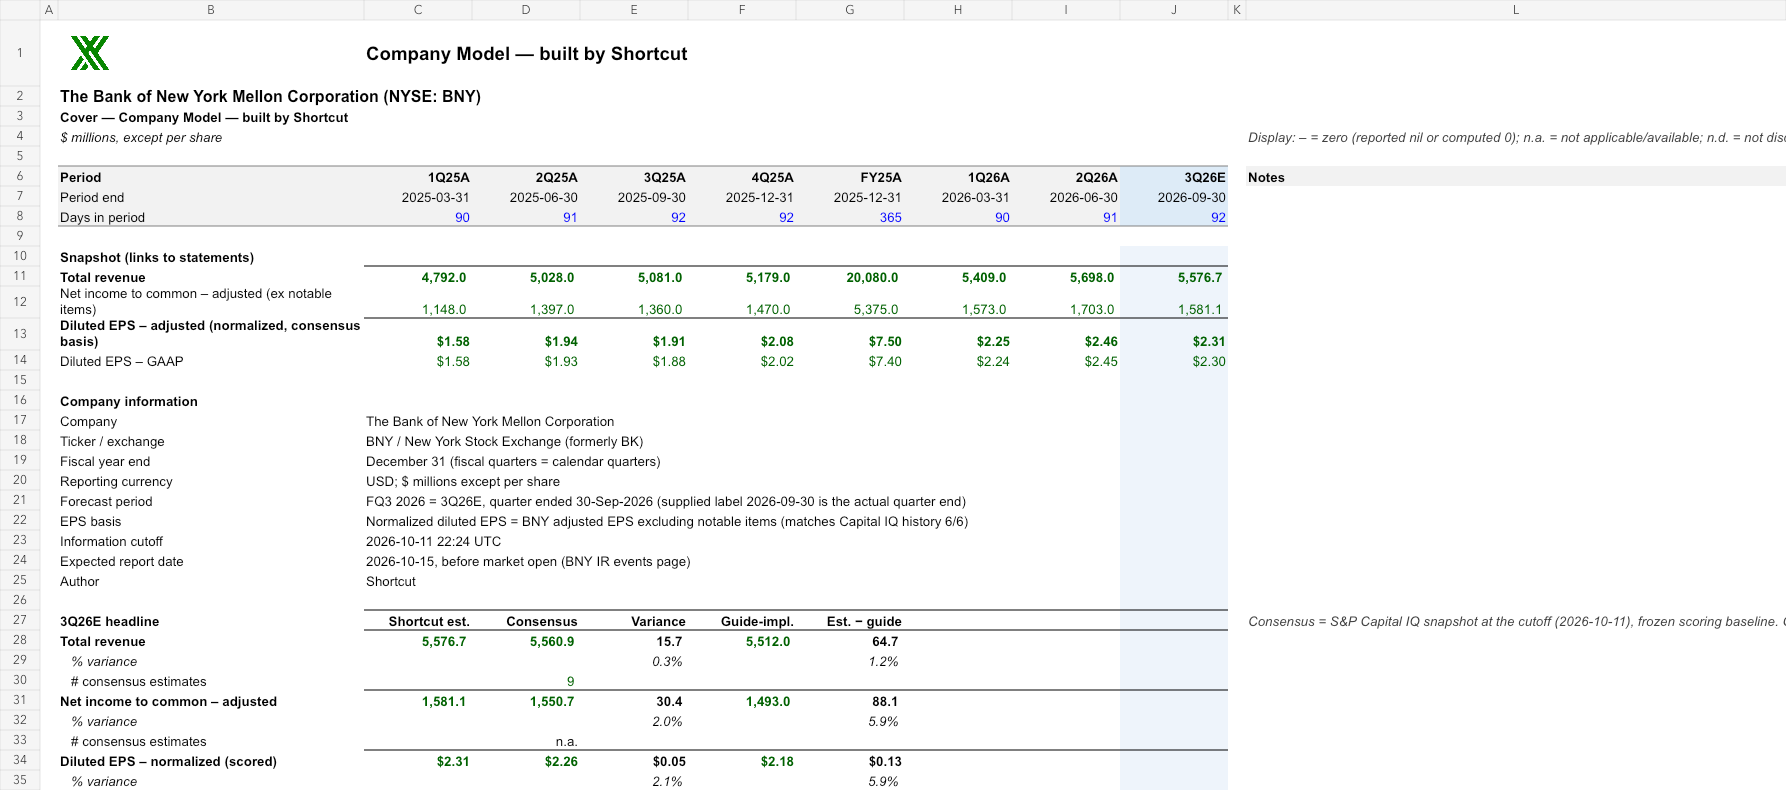
Behind the estimate.
The model forecasts $2.31 per diluted share for the quarter ended September 30, 2026.
Forecast and independent review: Opus 5.5 High in Shortcut.
Model assumptions and review notes
- Modeled normalized EPS; comparability with the frozen Street definition remains unconfirmed. The score compares published values directly.
- F2: consolidated average loans 86,500 (Revenue summary J96) vs segment sum 87,100; EPS +$0.0024 (to ~2.3092) if consolidated should be 87,100, $0 if a segment entry is wrong.
- F1: whether the normalized comparator excludes routine 3Q26 severance; if not, comparable EPS = GAAP 2.2955 (-$0.0112). Both 2.3067 and 2.2955 exceed consensus 2.26.
- F5: preferred series outstanding after the 2Q26 $583m redemption; EPS -/+ $0.00146 per +/- $1m of preferred dividends.
- F3: buyback excise accrual (~$11m equity) unsourced; absorbed by Balance Sheet plug J12; no EPS effect.
- consensus file internal inconsistency (EBT excl. 2,127.5 > EBT GAAP 2,125.87 while NI excl. 1,550.68 < NI GAAP 1,555.24) cannot be resolved from supplied evidence.
- Optional review note 3 not actioned: other uncaveated small-base growth rates outside the audited list (e.g. Income Statement H94 193.3% on a $15m 1Q25 base) remain display-only arithmetic; no EPS dependency.
- F1 comparator basis: confirm whether normalized 3Q26 consensus excludes severance. Sensitivity −$0.0112 (scored comparable EPS $2.2955 vs $2.3067).
- F2 average loans: consolidated 86,500 vs segment sum 87,100. EPS +$0.0024 only if the consolidated figure is wrong; $0 otherwise.
- F3 preferred dividends: series and share counts unverifiable. ∓$0.00146 EPS per ±$1m.
- F4 treasury-stock excise (about $11m): balance-sheet only, no EPS effect.
- Judgmental forecast inputs (ETR 22% vs ~23% guide, NIM 141.4bp, fee yields) preserved unchanged. Each 1pp ETR ≈ $21.2m ≈ $0.031 EPS (sensitivity only, not a defect).
- Audit completion is not acceptance. The model is publishable within the six-round limit only with the F1–F3 caveats stated.
On the record.
- Reporting period
- Q3 2026 (quarter ended September 30, 2026), ended 2026-09-30
- Reporting basis
- Normalized diluted EPS per common share, USD (BNY adjusted EPS excluding notable items; matches S&P normalized history 6/6)
- Published
- Oct 12, 2026, 2:36 AM PDT
- Model / effort
- Opus 5.5 · High effort
Original forecasts, models and publication times remain on the record.
Research sources
- https://www.sec.gov/Archives/edgar/data/1390777/000139077726000071/ex992_financialsupplementx.htm
- https://www.sec.gov/Archives/edgar/data/1390777/000139077726000071/ex993_quarterlyupdatepre.htm
- https://www.sec.gov/Archives/edgar/data/1390777/000139077726000042/ex992_financialsupplementx.htm
- https://www.sec.gov/Archives/edgar/data/1390777/000139077726000004/ex992_financialsupplementx.htm
- https://www.sec.gov/Archives/edgar/data/1390777/000139077726000004/ex991_earningsreleasex4q25.htm
- https://www.sec.gov/Archives/edgar/data/1390777/000139077726000071/ex991_earningsreleasex2q26.htm
- https://stockanalysis.com/stocks/bny/transcripts/363671-q3-2025/
- https://www.fool.com/earnings/call-transcripts/2026/04/16/bny-mellon-bk-q1-2026-earnings-call-transcript/
- https://www.fool.com/earnings/call-transcripts/2026/07/22/bny-bny-q2-2026-earnings-call-transcript/
- https://www.prnewswire.com/news-releases/bny-declares-dividends-302826325.html
- https://uk.investing.com/news/stock-market-news/bny-mellon-at-barclays-conference-growth-ai-and-crosssell-push-93CH-4868143
- https://www.sec.gov/Archives/edgar/data/1390777/000139077726000033/R8.htm
- https://www.sec.gov/Archives/edgar/data/1390777/000139077725000159/R7.htm
- https://www.sec.gov/Archives/edgar/data/1390777/000139077726000060/R7.htm
- https://www.sec.gov/Archives/edgar/data/1390777/000139077726000086/R7.htm
- https://www.morningstar.com/news/dow-jones/202609307962/sp-500-rises-203-this-quarter-to-765154-data-talk
- https://cetera.com/files/market-insights/cim-quarterly-recap-3q-2026.pdf-0
- https://www.federalreserve.gov/newsevents/pressreleases/monetary20260916a.htm
- https://secure.earningswhispers.com/article/BNY/20329
- https://www.benzinga.com/analyst-stock-ratings/price-target/26/10/62157927/bank-of-new-york-mellon-likely-to-report-higher-q3-earnings-these-most-accurate-analysts-revise-forecasts-ahead-of-earnings-call
- https://www.bny.com/corporate/global/en/investor-relations/quarterly-earnings.html
- https://www.hudson-labs.com/research/bny-q3-2026-earnings-revenue-preview-guidance-key-metrics
- https://www.sec.gov/Archives/edgar/data/1390777/000139077726000033/R61.htm